|
 The
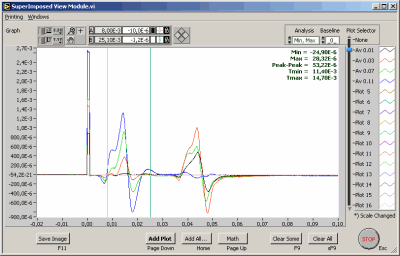
Superimposed View module, available from the Action menu, allows you to
superimpose (stack) data from different files, channels, classes, sweeps,
etc. into the same graph. The
Superimposed View module, available from the Action menu, allows you to
superimpose (stack) data from different files, channels, classes, sweeps,
etc. into the same graph.
Note: You can add as many plots as you like, but only the first
16 are available for analysis. Plot no 17 and above may be displayed in
inconvenient colors or even invisible! - Also plot no 17 and above will
not be labeled properly.
Add a Plot
You can add plots of any data already loaded (or acquired) into Mr. Kick:
- The sweep actually displayed - raw or pre-processed
- Any class average, whether actually displayed or not
 Click
the Add Plot button or hit the Page Down key and you will be able to specify
what you want to add: Click
the Add Plot button or hit the Page Down key and you will be able to specify
what you want to add:
- Processing: Choose from the actually displayed Raw or PreProcessed
Sweep or a class average, Averaged Sweeps
- Channel: One channel can be added, select which
- Class: If processing is set to Averaged Sweeps, choose which
class to add
- Plot Label: Choose an appropriate label to identify the plot.
Only a short label will be fully displayed in the Superimposed View
- Color: Plot color.
Data may be modified before thay are added:
- Gain: The original data can be boosted by any gain factor.
Would you like to compare EMG in the 10 µV range with torque
in the 10 Nm range - set the Gain factor to 1.00E+6 for the EMG
plot, and the two plots will display in the same y-range.
- Offset: The original data may be shifted in the y-direction,
eg. to align baselines of two different signals. Gain is applied before
Offset.
- Time Shift, s: The original data may be shifted in the x-direction
(time), e.g. to align stimuli given at different delays.
The plot label of modified data is prefixed by an asterix, '*', referring
to the "Scale Changed" below the legend. Note: Modified
data does not display correctly relative to the x- and/or y-axis of the
graph; also analysis is affected by modifications!
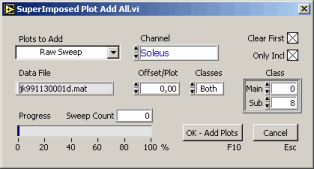
Add Multiple Plots
 You
may also add mutiple plots: You
may also add mutiple plots:
- Add all sweeps in a certain class - raw or pre-processed
- Add all class averages
 Use
the Add All...-button to access this feature: Use
the Add All...-button to access this feature:
- Plots to Add: Choose which type -
- Raw, label will be Rw n, where n is the sweep no.
- Pre-processed, label will be Pp n.
- Averaged, label will be Av m.s, where m.s is the class
id (main.sub).
- Channel: One channel can be added, select which.
- Clear First: Allows you to clear all previously added plots
before adding new ones.
- Only Incl: When adding raw or pre-processed sweeps, choose
wether to add only included sweeps or all sweeps.
- Data File: Displays the name of the actual datafile (for information
only).
- Offset/Plot: Adds an offset to each plot (see note below)
- first plot is not offset, second plot is offset by 1x the specified
amount, third plot is offset by 2x the amount, etc.; if zero no offset
is applied.
- Classes: May be either Main, sub or Both -
- Main - Sweeps or averages in a certain main class is added,
regardless of the sub class;
- Sub - Sweeps or averages in a certain sub class is added,
regardless of the main class;
- Both - Sweeps in a certain class is added, both main and
sub class are taken into account. If adding averages, all classes
will be added.
- Class:Choose the class to add sweeps or averages from.
- Progress and Sweep Count: Displays the progress while
plots are generated.
The plot label of offset data is prefixed by an asterix, '*'.
Note: Offset data does not display correctly relative to the y-axis
of the graph; also analysis is affected by the
offset!
Math
 The
Math button is your way to applying some simple mathematical functions
to existing plots: The
Math button is your way to applying some simple mathematical functions
to existing plots:
- Add any two plots.
- Subtract any two plots; Second Plot will be subtracted from
the First Plot.
- Multiply any two plots.
- Divide any two plots; First Plot will be divided by the Second
Plot.
- CrossCorr between any two plots: Calculates the cross correlation
between the two data set. Center half of sequence is displayed.
The result will be displayed as another plot.
Choose which two plots to use, choose the Math Action to apply, then
Label and color the new plot properly and click OK - Add Plot. The two
plots may actually be one and the same, eg. if you want to square all
samples in one plot, choose that plot as both first and second and multiply
them.
Math can only be applied to plots that overlap (in the x-direction).
Only the overlaping section will be included in the calculations.
The two plots, which the math is applied to, may not be 'alligned', e.g.
not sampled at the same rate or shifted in time so that samples are not
aligned. If this is the case then the Second Plot is interpolated to match
the First Plot.
Cursor Related Analysis
 Just
as in the main display panel you can analyse the displayed data by use
of the cursors: One plot can be analysed at a time - select which plot
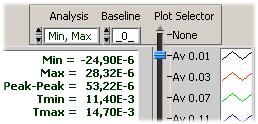
via the vertical slider between the graph and its legend (blue knob).
Cursors will lock to the selected plot. Just
as in the main display panel you can analyse the displayed data by use
of the cursors: One plot can be analysed at a time - select which plot
via the vertical slider between the graph and its legend (blue knob).
Cursors will lock to the selected plot.
You select which set of analysis methods to appy via the Analysis selector
above the graph (right side). Learn more about
cursor related analysis here.
Note: Analysis is applied to the plotted data, which may be modified
(*-marked or math generated) - not the original data: E.g. if a gain factor
of two was applied when the plot was added to the graph, then amplitude
values will be displayed a factor of two too high!
Clear Some or All Plots
You can clear all existing plots by pressing the Clear All button. A
warning will appear if any plots exist.
You may also clear individual plots: Click the Clear Some button and
choose from the list of existing plots. Plots are identified by the Labels
given to them when added - plots are listed in the order they were added.
Hold down the Shift button on the keyboard to select more than one plot.
When ready click the Clear Selected button.
Printing & Save Image
The SuperImposed View module supports printing of the window: Via the
Printing menu you can access Page Setup and Print Window features.
You can also save an image of the Window to a graphics file - simply
press the Save Image button (lower right). The file format will be PNG,
Portable Network Graphics.
For more information on PNG, see: W3C's
introduction or the official
homepage of PNG.
Exit
Click the STOP button to terminate the Superimposed View module. All
plots will be cleared - a warning will appear if any exist!
|
