|
This display plug-in resembles the classic Mr Kick graph display element. It shows the the signal from one analog input channel in time domain, ie. x-axis is time and y-axis is amplitude. The amplitude can be-
- the present Raw sweep (ie. no pre-processing applied)
- the present PreProcessed sweep (pre-processing applied)
- the Average of all included, pre-processed sweeps in a given class.
This can be displayed-
- alone: Mean
- along with -1 Standard Error: Mn-SE
- along with -1 Standard Deviation: Mn-SD
- the Root-Mean-Square of all included, pre-processed sweeps in a given class.
This can be displayed-
- alone: RMS
- along with -1 Standard Error: RMS-SE
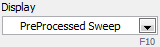 This is specified via the Display mode control in the main display window and applies to all TimeSignalGraphWithCursorAnalysis a.o. plug-ins. This is specified via the Display mode control in the main display window and applies to all TimeSignalGraphWithCursorAnalysis a.o. plug-ins.
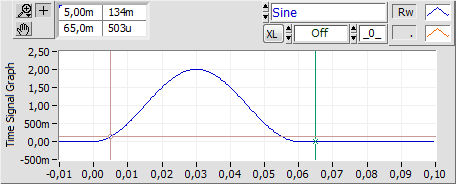 This example shows a single sweep of raw data from the analog input channel labelled "Sine" (in fact the signal sampled is a haver sine with an amplitude of 2.0 and a cycle time of 60ms). This example shows a single sweep of raw data from the analog input channel labelled "Sine" (in fact the signal sampled is a haver sine with an amplitude of 2.0 and a cycle time of 60ms).
Both x- and y-axis is set to auto-scale, hence showing the full sweep length of 110ms with 10ms pre-trig. You can set scaling mode: Right-click the graph and select in the pop-up menu. The x-axis can either auto-scale or you can manually type in your preferred range directly on the axis. The y-axis has one more option: Auto-scale and include zero (wether in the signal amplitude range or not).
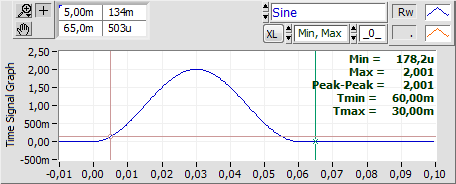 This plug-in features Cursor Related Analysis incl. Excel export of the results ("XL" button). This plug-in features Cursor Related Analysis incl. Excel export of the results ("XL" button).
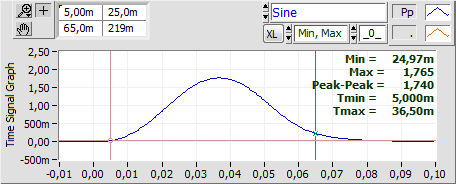
In this example Min/Max-analysis is applied relative to a baseline of 0 (zero; indicated by "_0_").
 The cursors can be positioned either by draging them with the mouse, or typing in the x-axis position in the left column of the table left above the graph. The right column shows the signal amplitude at the cursor position. Top row is the left cursor, second row shows right cursor position and amplitude. The cursors can be positioned either by draging them with the mouse, or typing in the x-axis position in the left column of the table left above the graph. The right column shows the signal amplitude at the cursor position. Top row is the left cursor, second row shows right cursor position and amplitude.
When display mode is Raw or PreProcessed, then only one trace is shown. Trace legend is "Rw" for raw and "Pp" for pre-processed data.
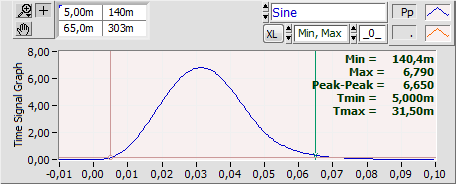
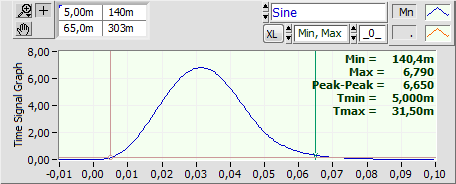
 Here display mode is set to PreProcessed. Here display mode is set to PreProcessed.
Y-axis scaling is set to manual and kept the same as above.
Pre-processing in this case applies a 1st order low-pass filter with cut-off frequency at 20Hz to the signal, hence max ampitude is lower and the signal delayed.
  Any sweep can either be included (left) or excluded (right) from averaging. Like with Display mode this is specified in the main display window and applies to all input channels in the present sweep. Any sweep can either be included (left) or excluded (right) from averaging. Like with Display mode this is specified in the main display window and applies to all input channels in the present sweep.
 In the example data set sweep no. 5 is excluded, hence shown on grey background. In the example data set sweep no. 5 is excluded, hence shown on grey background.
Display mode is still PreProcessed.
Class is 1.3.
 A signal averaged over all included, pre-processed sweeps in a class is displayed on a light yellow background. A signal averaged over all included, pre-processed sweeps in a class is displayed on a light yellow background.
Display mode is Average(sweeps) Mean. Trace legend is "Mn".
If display mode is RMS(sweeps) background will be light blue and trace legend "Rms".
If you choose a display mode that includes standard error or stadard deviation a second trace will show up and legend will be "-SE" or "-SD". The soncond trace will show the signal mean (or RMS) minus one standard error (or standard deviation).
Back to Display Plug-In Index
|
